Canvas
It's where you can have an eye bird view of all the nodes and how they are connected together, and also if you have a selected iteration, you can see where the failure is and what the error messages and the progress for each node, it's the main playground for the developer, and it's easy drag and drop.
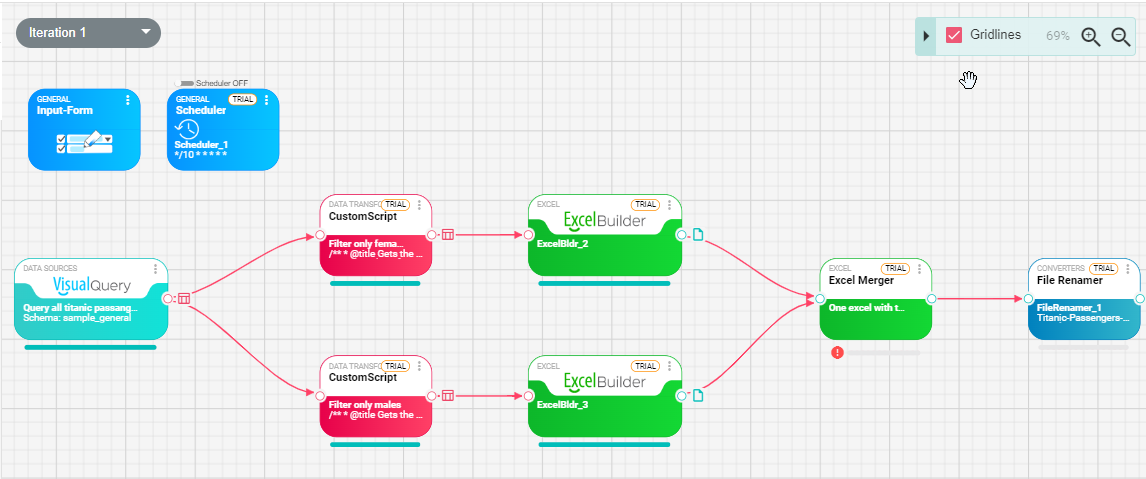
A screenshot of canvas with multiple types of nodes, and a selected iteration with its data loaded.
Add node to canvas/Dragging nodes
In order to add a node to the canvas you need to drag it from the left side Toolbox which contains all the nodes available in your system.
In the toolbox you can filter the nodes by filling this search area at the top:

Connecting nodes
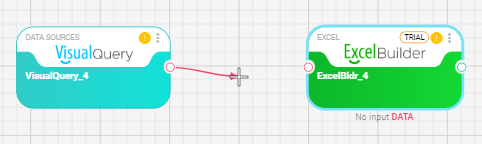
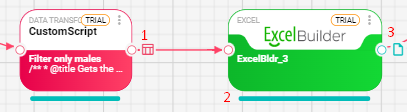
After you have two nodes added to the canvas like this:
You can drag the output port of the first node, in this example it's VisualQuery_1 and as you are dragging a connector will appear following the mouse:
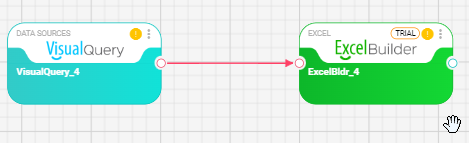
connect this to the input of the ExcelBuilder_1 node and then a connection will be formed like this:
UI Elements:
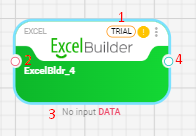
Node elements
-
The configuration warnings that this node needs, for example: Node is not configured, or node is disconnected
-
The input port of this node, if you hover over the port, you can see what type of input it needs: DataFrame/NodeFile/…
-
If there is an execution for this node the progress will appear here and if there is any run-time messages will appear next to the progress bar like this:

If you hover over the blue icon a detailed message will appear for this information or warning or error, node can generate multiple warnings/information and error messages at once.
-
The output port of this node, not all nodes have an output, hovering over the port will display the type.
- The customScript node has output a DataFrame. This is the DataFrame icon, if you click on it a display will appear in the bottom bar, more on this in the Run Iteration -> Run Details section.
- A progress bar that appears when there is an execution to show the progress completed for this node.
- ExcelBuilder node outputs an Excel file, this is an icon indicating it's a file, if you click on the icon, you can download the file from the Run Details in the bottom.
Undo/Redo
Any operation done on the canvas can be undone even if it's a setting that has been changed inside the node itself.
The undo/redo buttons are at the top of the canvas:

Autosave
To prevent the user from losing changes, by default we turn on autosave for the workflow, so each action done will be automatically saved and can be undo/redo ed.
But sometimes users might want to change or test new settings without saving the changes automatically and that autosave can be turned off.
To turn off this feature at the top right corner you will find:

By default, it's per user, and can be changed from the user's profile, but you can change this by clicking on Per User and change it to per workflow and turn it off and on according to your needs.