Dashboard
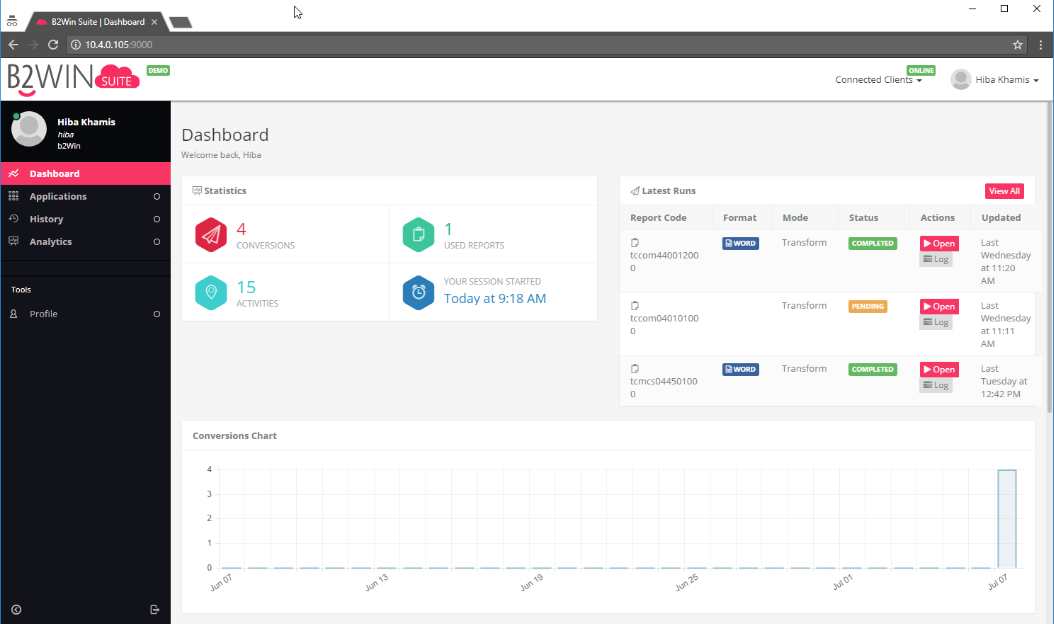
In the dashboard, you will find statistics and charts describing your activities, by default it will show the last 30 days
Statistics
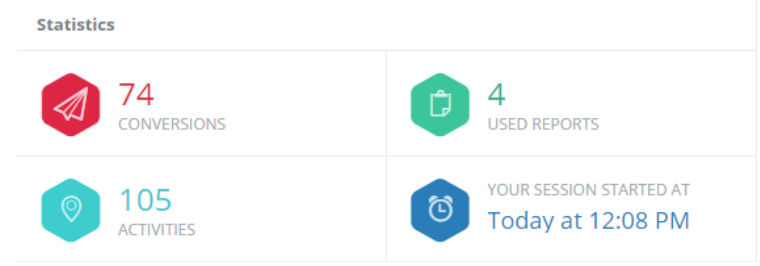
In statistics, you can see the number of reports you used and how many times have you converted them, the number of activities and when you started the session
Latest Runs
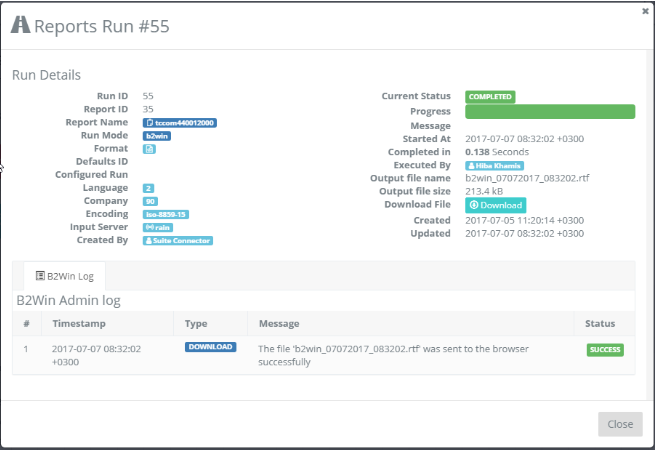
View Log
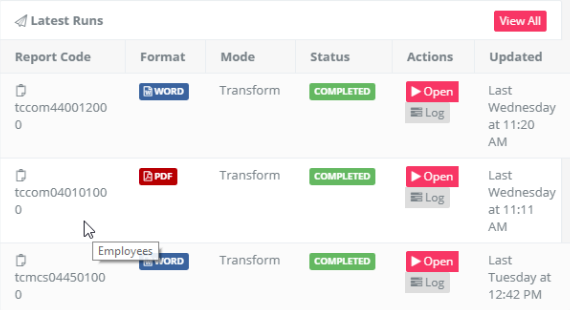
You can see here the latest runs (conversion) you did, you can rerun any of them, you can also view the logs to see the details of the run and re download the output:-
Conversions Chart
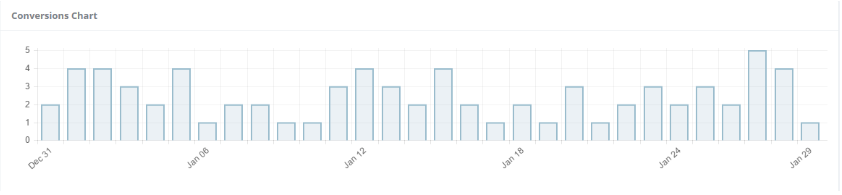
It shows you how many conversions you did each day in the desired period of time.
Used Reports
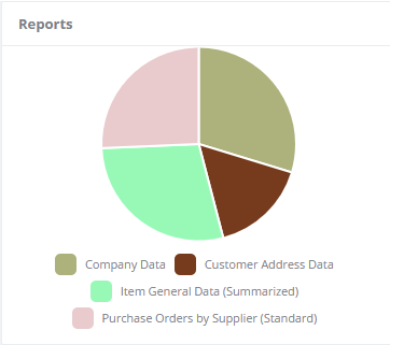
It shows the number of reports used in B2Win Suite, when you put the mouse over each color it will show you the name and number of time used.
Conversion Formats
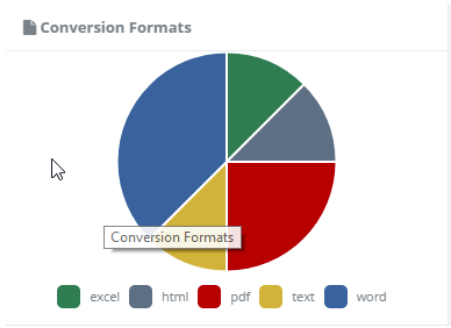
It shows you what formats were the reports converted to, when you put the mouse over each color it will show you the format type and number of conversions.