Visual Query
Getting Started
This manual describes the node Visual Query listed in the B2Data Builder. The Visual Query is an interactive visual tool that can create queries. The query is needed in order to extract data from a database. In the following manual, we will discuss how to build queries.
Visual Query overview
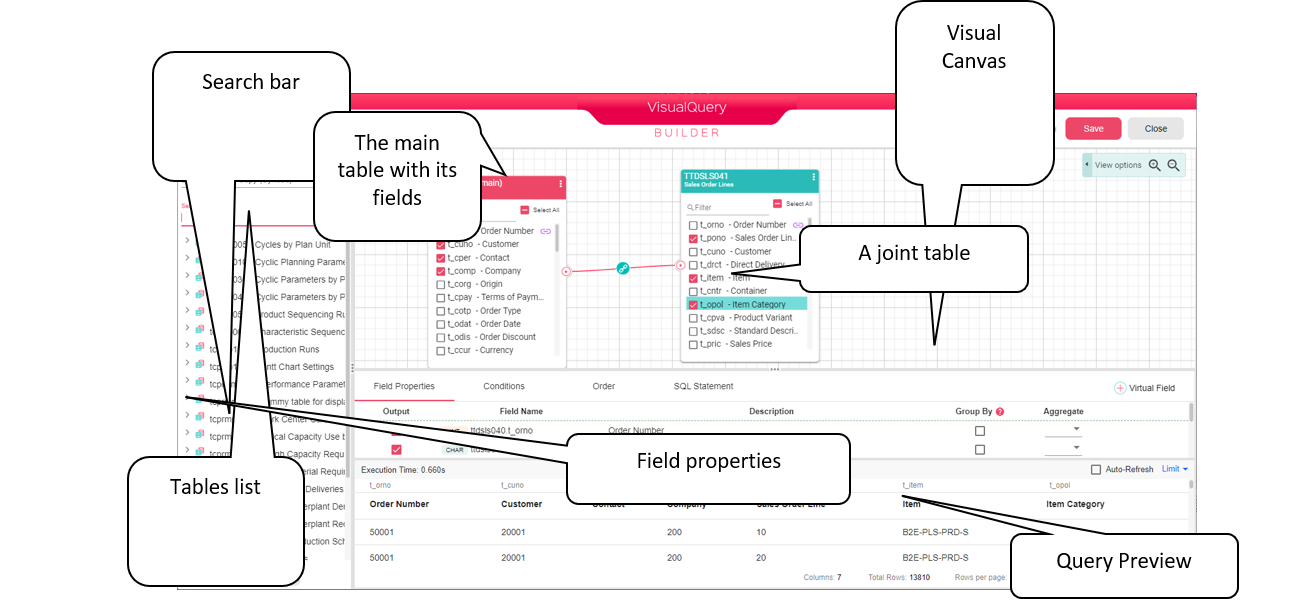
The Visual Query contains four parts. On the left is a tree view containing the DB tables. The main screen is divided into three parts, the visual canvas, fields properties (conditions, sort and SQL statement – where you can see the actual SQL code) and the query partial result preview which is automatically (if Auto-Refresh is checked) or manually updated after each time you change your query.
At each stage you can save the query and use the undo and redo buttons that are on the top right of the window.
In case your query outputs large results and takes time, you can disable the Auto-Refresh option on the top right part of the Query Preview part or you can limit the preview to a specific number of records.

Click on the Limit button and you can set a limit for the number of rows in the preview or set the number of rows to be skipped if needed.
You can also change the table fields view options if you click on the View options on the top right part of the visual canvas.

Show used fields only - when this option is selected then in each table in the visual canvas you will see the used fields only.
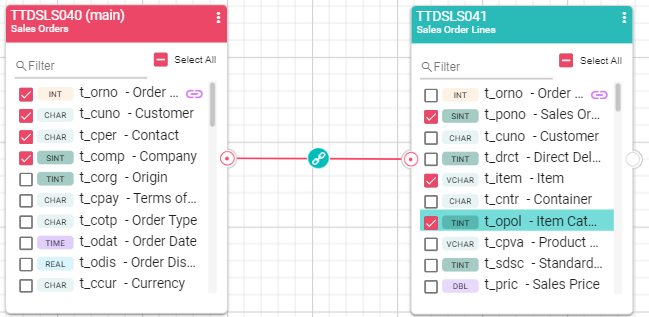
Show data types - when this option is selected then you will have fields data types displayed next to each field in the table in the visual canvas
In the following chapters we will describe how to create a new query, with joins, conditions, sorting, group by and more.
Visual Query
Create a New Query
Drag the node Visual Query from the B2Data Builder left sidebar to the workflow in order to create a new query.

Double click on the node, and you will get to choose the database for the query.
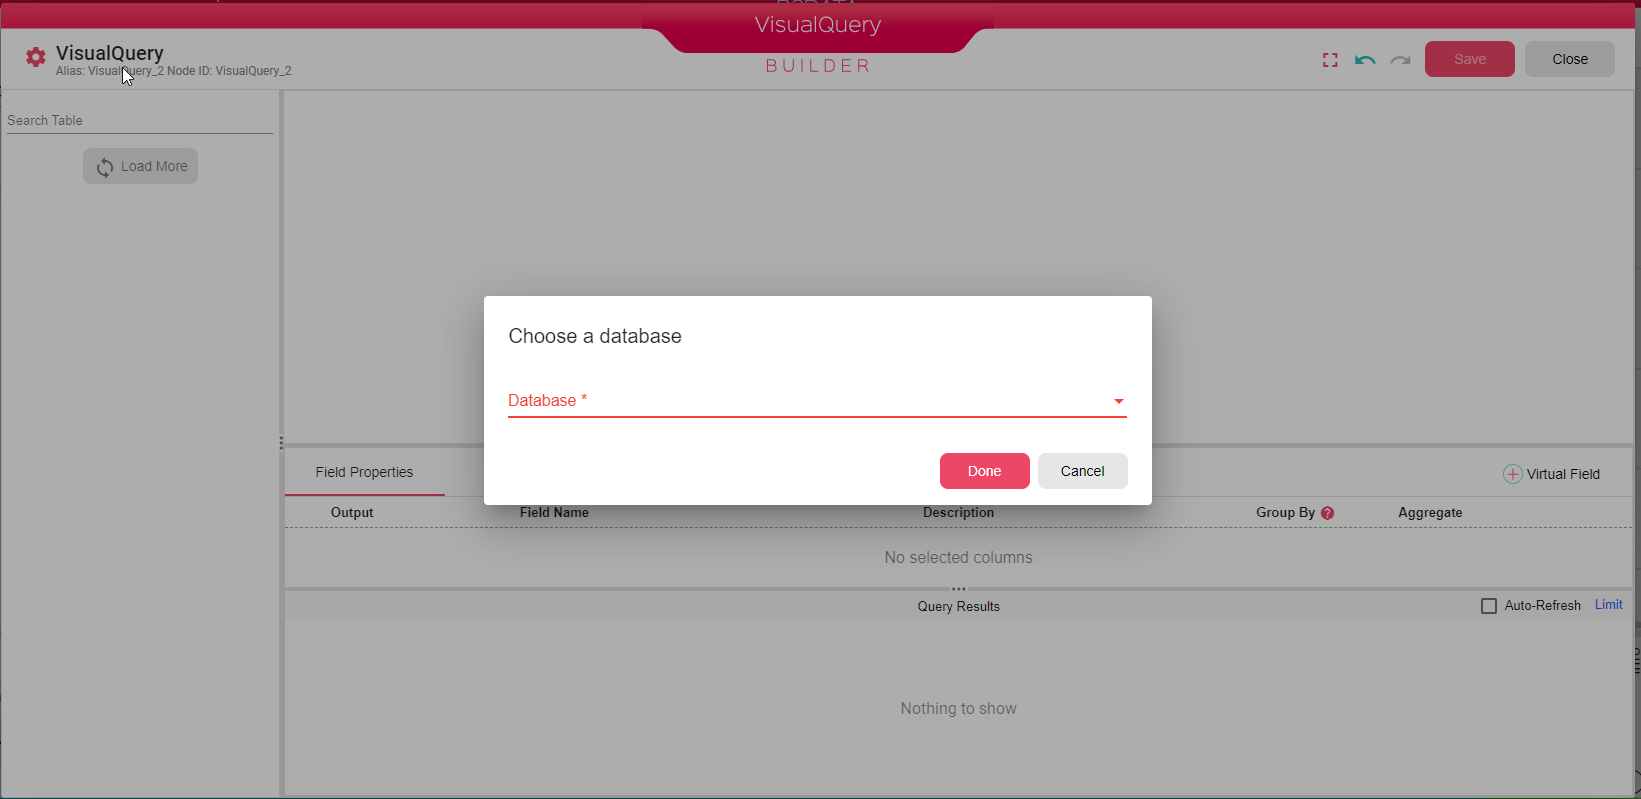
DataBase Connections should be defined and the schema should be synced in B2Win Suite by the administrator before being used in the Visual Query.
Tables
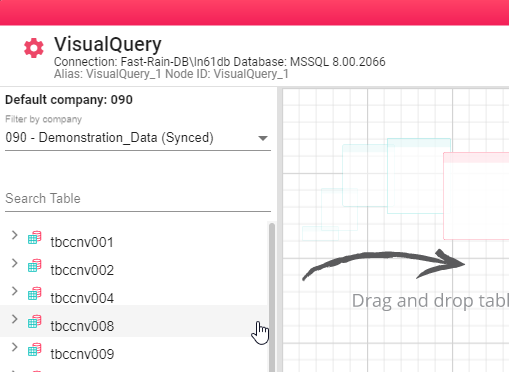
When you select the database, you will get the list of tables in the tree on the left. You can use the search for the tables that you want to use in your query in the left top side of the Visual Query. You can search by table code or table name. After you find the table that you want, drag it into the canvas.

In Infor LN, each table is under a company, therefore if you selected a DB Connection of type Infor then you will need to select a company.
You can always change the company by selecting a different one from the list at the top left part of the Visual Query.
Main Table
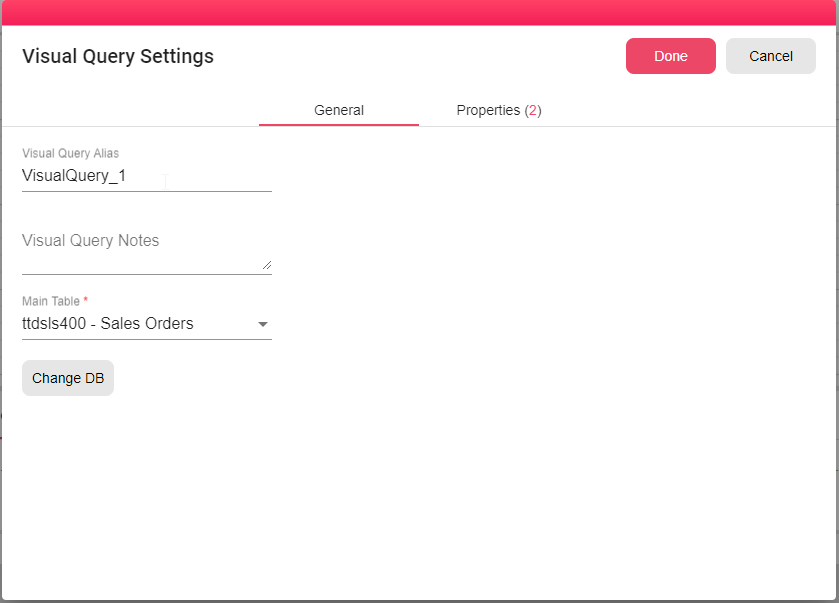
The main query table is the first table you drag to the canvas. You can change this by clicking the gear icon on the top left corner:
Joining Tables
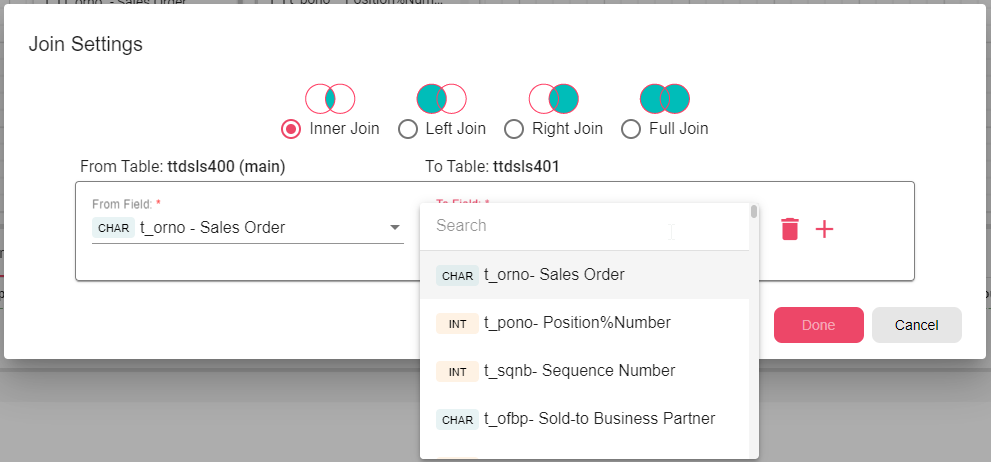
When you add more than one table, you need to specify the field which links the two tables in this join. There are two ways to do the join. The first is a dialog that appears when you drag the second table to the canvas, and then you need to fill the join fields from both tables and specify the join type (inner, left, right or full join):
This join dialog will open again, and can be used to edit the join settings, if you click on the join icon that links the two tables together.
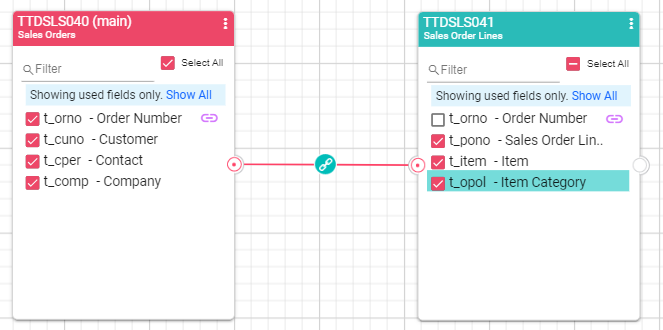
The second way to make the join is to drag the field from the first table and drop it on the field you want to join to from the other table.
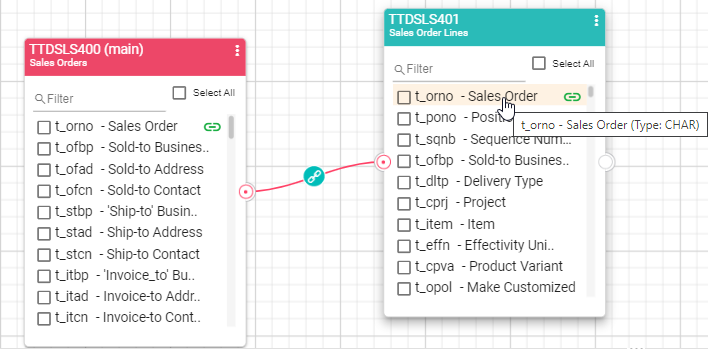
The Join fields will have a colored join icon next to them to help you identify the join you made without opening the join dialog again.
![]()
Sometimes the Visual Query will suggest a join field when you drag a new table to the canvas.

You can either click “join” to join tables according to the suggestion or “dismiss” and you will get the Join Settings dialog to manually insert the joined fields.
Views
Views are based on queries over one or more tables in the database. These views are treated as regular database tables within the query interface.
In the following example a new view is created with two fields, order number and the total amount for all order lines.
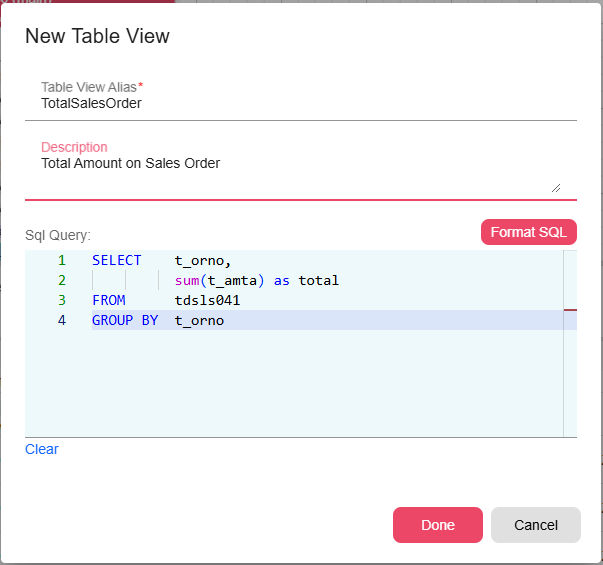
The new view is treated just like a regular table and can be joined with any other table. You can click on the three dots at the top right corner of the view and select Settings to edit the view sql query.
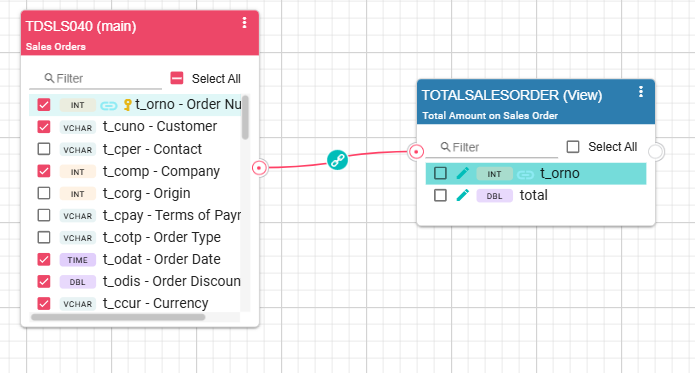
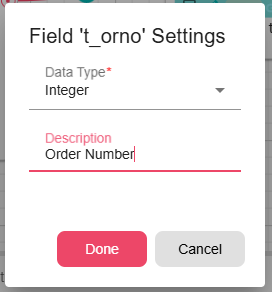
Click on the pen next to the view field to edit its type or description.
Fields
From within the table, check the fields that you want to use in your query. These fields can be used in the query output (select), conditions or query sort.
The fields are automatically added to the query output. You can see the output in the query preview pane. If you don’t want a field to appear in the output, uncheck the output checkbox in fields properties tab:
When you unselect the field, the query result will be updated in the preview pane. Notice that, when the output checkbox is unselected, the field can still be used in the query condition and sort.
-
Field Conditions
The Visual Query has a special visual interface to help you create conditions. You can create a group of conditions, or single conditions that are related together under one group. Each group sets the logical relation between the condition that it contains, it can be an “Or” relation or an “And”.

You can also add sql script condition, where you can write your condition in your database sql format. For example:

In the following example we have two conditions, under the main group with an “And” relation. The query result will show all the rows that the supplier code equals “0001” and the item price is greater or equal to 1:

You can change the “And” to “Or” simply by clicking on the “Or”.
In each condition field, you can also create query formulas that can use arithmetic equations and some query functions like abs, concatenate, get current time stamp, length, lower, left trim, replace, round, right trim, square root, substring, trim and upper. These functions are also dependent on your DB version, and so some of them might not work. For more details on this subject, contact us.
Query formula examples:
![]()
![]()
As mentioned before, group conditions are also available. Groups can be understood as parentheses in the condition. The following example is the visualization of:
Tdpur041.pric>=10 and (tdpur041.suno = “0001” or tdpur041.opol = 02)
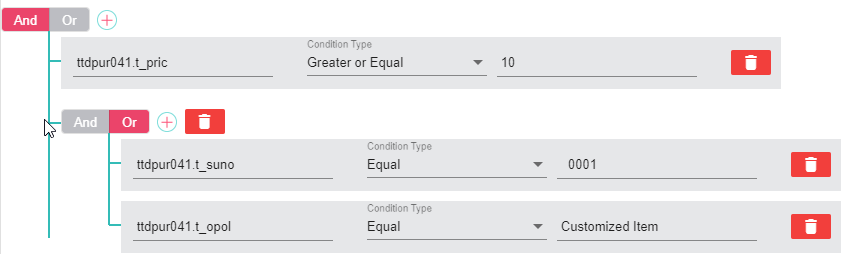
Notice that the main group has an “And” operator, while the inner one has “Or”.
-
Order
You can add order by the query result by simply going to the Order tab and drag the fields that you want to order by from All Fields area to the Order Fields area.
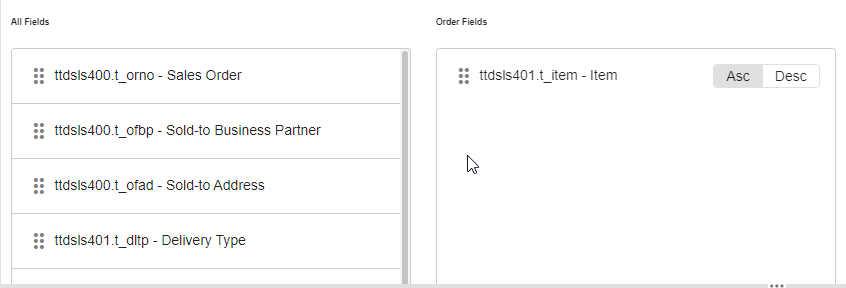
You can also choose the order by order for each order by field by clicking on Asc (Ascending) or Desc (Descending).
Group By and Aggregation
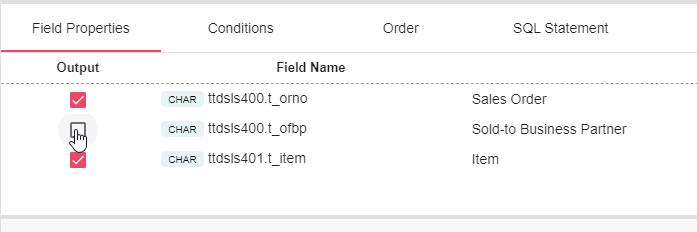
The Visual Query may have fields with aggregation functions such as average, count, sum, max and min. From within the Field Properties tab, select the aggregation function that you want to use, then all the other fields that are checked for the output (Supplier in the example below), must be in the group by:
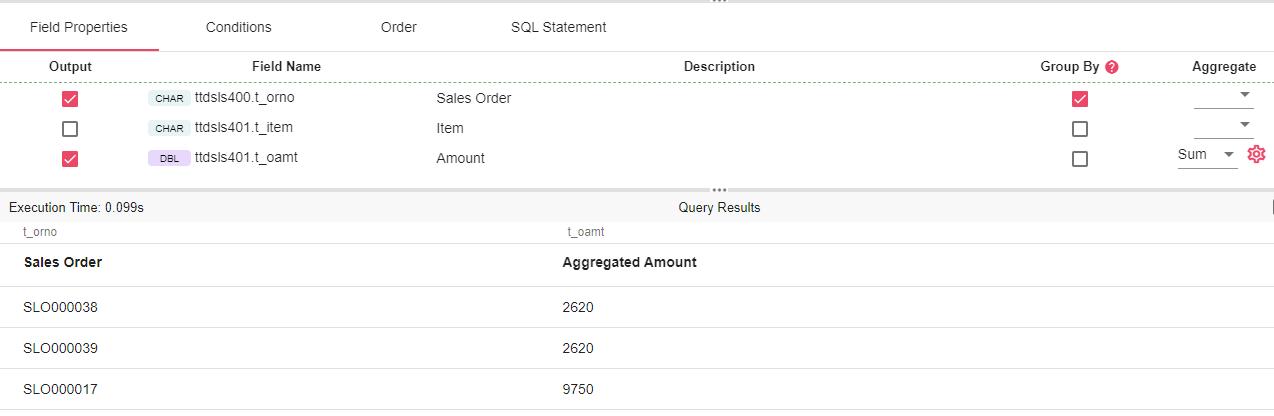
This example will sum the amounts of orders and group by the order number. Notice that the item field is not selected for the output, yet it can be used in the conditions for example.
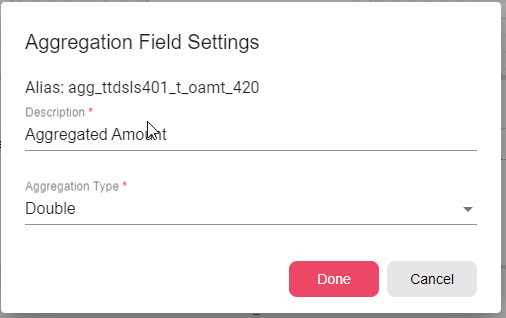
The aggregated column header will automatically be updated with the word “aggregated”. You can change the description by clicking on the gear icon next to the aggregation field. You can also change the aggregation field data type.
Virtual Fields
You can add a virtual field which is based on other fields that are already in the query. The virtual fields could be a formula or sql query. The formula has auto complete for the fields and functions that could be used but is limited. So in case you need to use a complex function or syntax that is not supported in the formula mode, you can use the sql query mode and write your virtual field value in your database sql syntax.
Here is an example that calculates the amount in USD currency, achieved by multiplying the amount with the currency rate in formula mode.
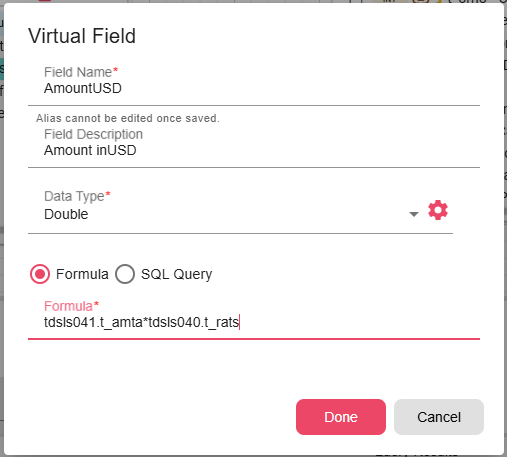
When you click on Done, the field will appear in the fields properties. You can edit and delete it from there.
This new virtual field can be used as any other field, for example, in the conditions, order.
View Options
On the top right of the Query Builder canvas there are view options. You can zoom in and out, show or hide the fields data types in the tables and also to show only the fields that are used in the query.
